Linux Content Index
— File System Architecture – Part I
–– File System Architecture– Part II
–– File System Write
–– Buffer Cache
–– Storage Cache
Why File System as a Loadable Kernel Module(LKM) ?
As you can see, user space idea didn’t pan out quite well:http://tekrants.me/2012/05/22/fuse-file-system-port-for-embedded-linux/
VFS Data Structures
Inode is probably the most critical abstraction which defines a VFS file entry — This represents every file/directory/link within a file system. If your file system is like FAT and lacks a clear “inode”, then a translation layer will be needed. Eventually it’s about extracting the file information associated with a Linux inode from the file system specific data structures.
File System Initialization Sequence
1. Register file system mount & unmount call backs with the VFS.
2. Mount call is responsible for creation and registration of a root directory inode .
3. Root directory inode is essentially the point of entry to the volume. It furnishes specific function pointers later invoked by VFS for inode related operations (like create) and file operations (like open,read) & directory operations (like readdir).
The above three steps and your file system module is all set, this means Linux will have enough information to translate an “Open” call from application to the file system specific internal open call, thanks to the function pointers inside the root inode.
Dentries
Another kernel structure which exists for every file & directory is a Dentry. For example, accessing a path “/mnt/ramfs” will lead to creation of two in memory dentry structures. One each for “mnt” and “ramfs”. Note that “ramfs” dentry will have a parent pointer to “mnt” dentry and a pointer to its own VFS inode. A Dentry in fact encompasses the attributes like name & handle to parent directory of a file system entry. One of the rationales behind separation of an Inode from these attributes is the existence of file links, where a single Inode is shared across multiple Dentries.
Opening a file — Easily said than done!
a. Consider opening a file with the path “/mnt/ramfs/dir1/dir2/foo.txt”
b. The dentry elements in the above path are “mnt”, “ramfs”, “dir1”, “dir2” & “foo.txt”
c. “mnt” dentry will be part of Linux root file system, all dentries are part of a hash table, the string “mnt” will map to a hash table entry giving its dentry pointer. VFS gets the inode pointer from this dentry and every directory inode has a callback function for look-up operation listing on its file/directory entries.
d. Look up called on “mnt” inode will return the inode for “ramfs” along with its dentry.
c. This is an iterative process and eventually VFS will figure out the inodes & dentries of all the elements in a file path.
d. Note that the Inode associated with “foo.txt” will give the open function pointer to invoke the open call specific to the file system driver.
VFS
A file system ported to Linux is expected to populate the fields of VFS data structures like Inodes and Dentries so that Linux can understand and convey the file attributes and contents to the user. The obvious differentiating factor across file systems like ext4, UBIFS, JFFS2 etc are their respective algorithms, which also defines the internal data structures and device access patterns.
How Dentries/Inodes are represented and accessed from a storage is specific to file system and this inherently defines their strengths and weaknesses. In crude terms, a file system in Linux comprises of a set of call backs for managing generic VFS data structures, basically the Inodes, Dentries, file handlers etc. So we have inode data structure and corresponding associated inode operations, we have file pointer data structure and file operations, dentry data structure and dentry operations and so on.
The crux of a Linux file system is its ability to talk in Linux kernel language of Inodes and Dentries. Also, unless it’s a read only volume this interpretations needs to be done in reverse too. When user makes changes to a file then a file system needs to comprehend the Linux talk and translate those changes into a representation which it might have on the storage. Undoubtedly, comprehending Linux VFS mandates deep understanding of Kernel data structures which might mean that a file system writer needs to have a kernel specific layer in the file system code, this undesirable complexity can be immensely reduced by the use of kernel library functions.
Functions which usually start with “generic_” can be interpreted as such a helper function which abstracts the kernel specifics from a kernel module, this is widely used for file system operations like “read”, “write” and even unmount. The usage of generic helper functions within a kernel module can be confusing when studying the code, because they tend to blur the kernel and a module specific boundaries, this overlap is convoluted but an extremely effective way to avoid kernel dependencies.
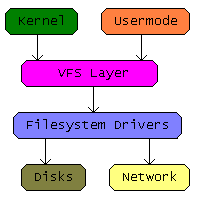
Image Source : http://wiki.osdev.org/images/e/e5/Vfs_diagram.png

Some design philosophy
The design thought behind Linux VFS seems to of “choice”, other than a bare minimum there is always a choice provided to the kernel hacker regarding the implementation of an interface. He or she can either use a generic function, create a custom one or simply set it to NULL. This is an ideal approach for supporting a plethora of widely differing devices and file systems, quite easily visible when we look at the code of an ext4 where there is buffer cache abstraction usage over page cache, compared to page cache sans buffer for UBIFS, versus a direct to the device approach of JFFS2. Accommodating all these widely varying designs requires a flexible rule of law driven framework where everyone can find their niche and yet not impinge on the functionality of another kernel module.


